Balaji Foods Sales Dashboard
This Power BI dashboard tracks weekly sales, item performance, and payment breakdowns for a fictional fast-food business. Built after a robust ETL pipeline to clean and engineer raw transaction data.
Business Challenge
Without structured reporting, Balaji Foods lacked clarity on its top-performing items, busiest sales periods, and overall trends. A clean data pipeline and visual dashboard helped bring clarity to day-by-day patterns and weekly performance.
Tech Stack
- Python & Pandas for data cleaning
- Custom logic for date parsing and verification
- Power BI with DAX for KPIs and visuals
- CSV files as raw and output datasets
Dashboard Highlights
1. Product Performance & Sales Composition
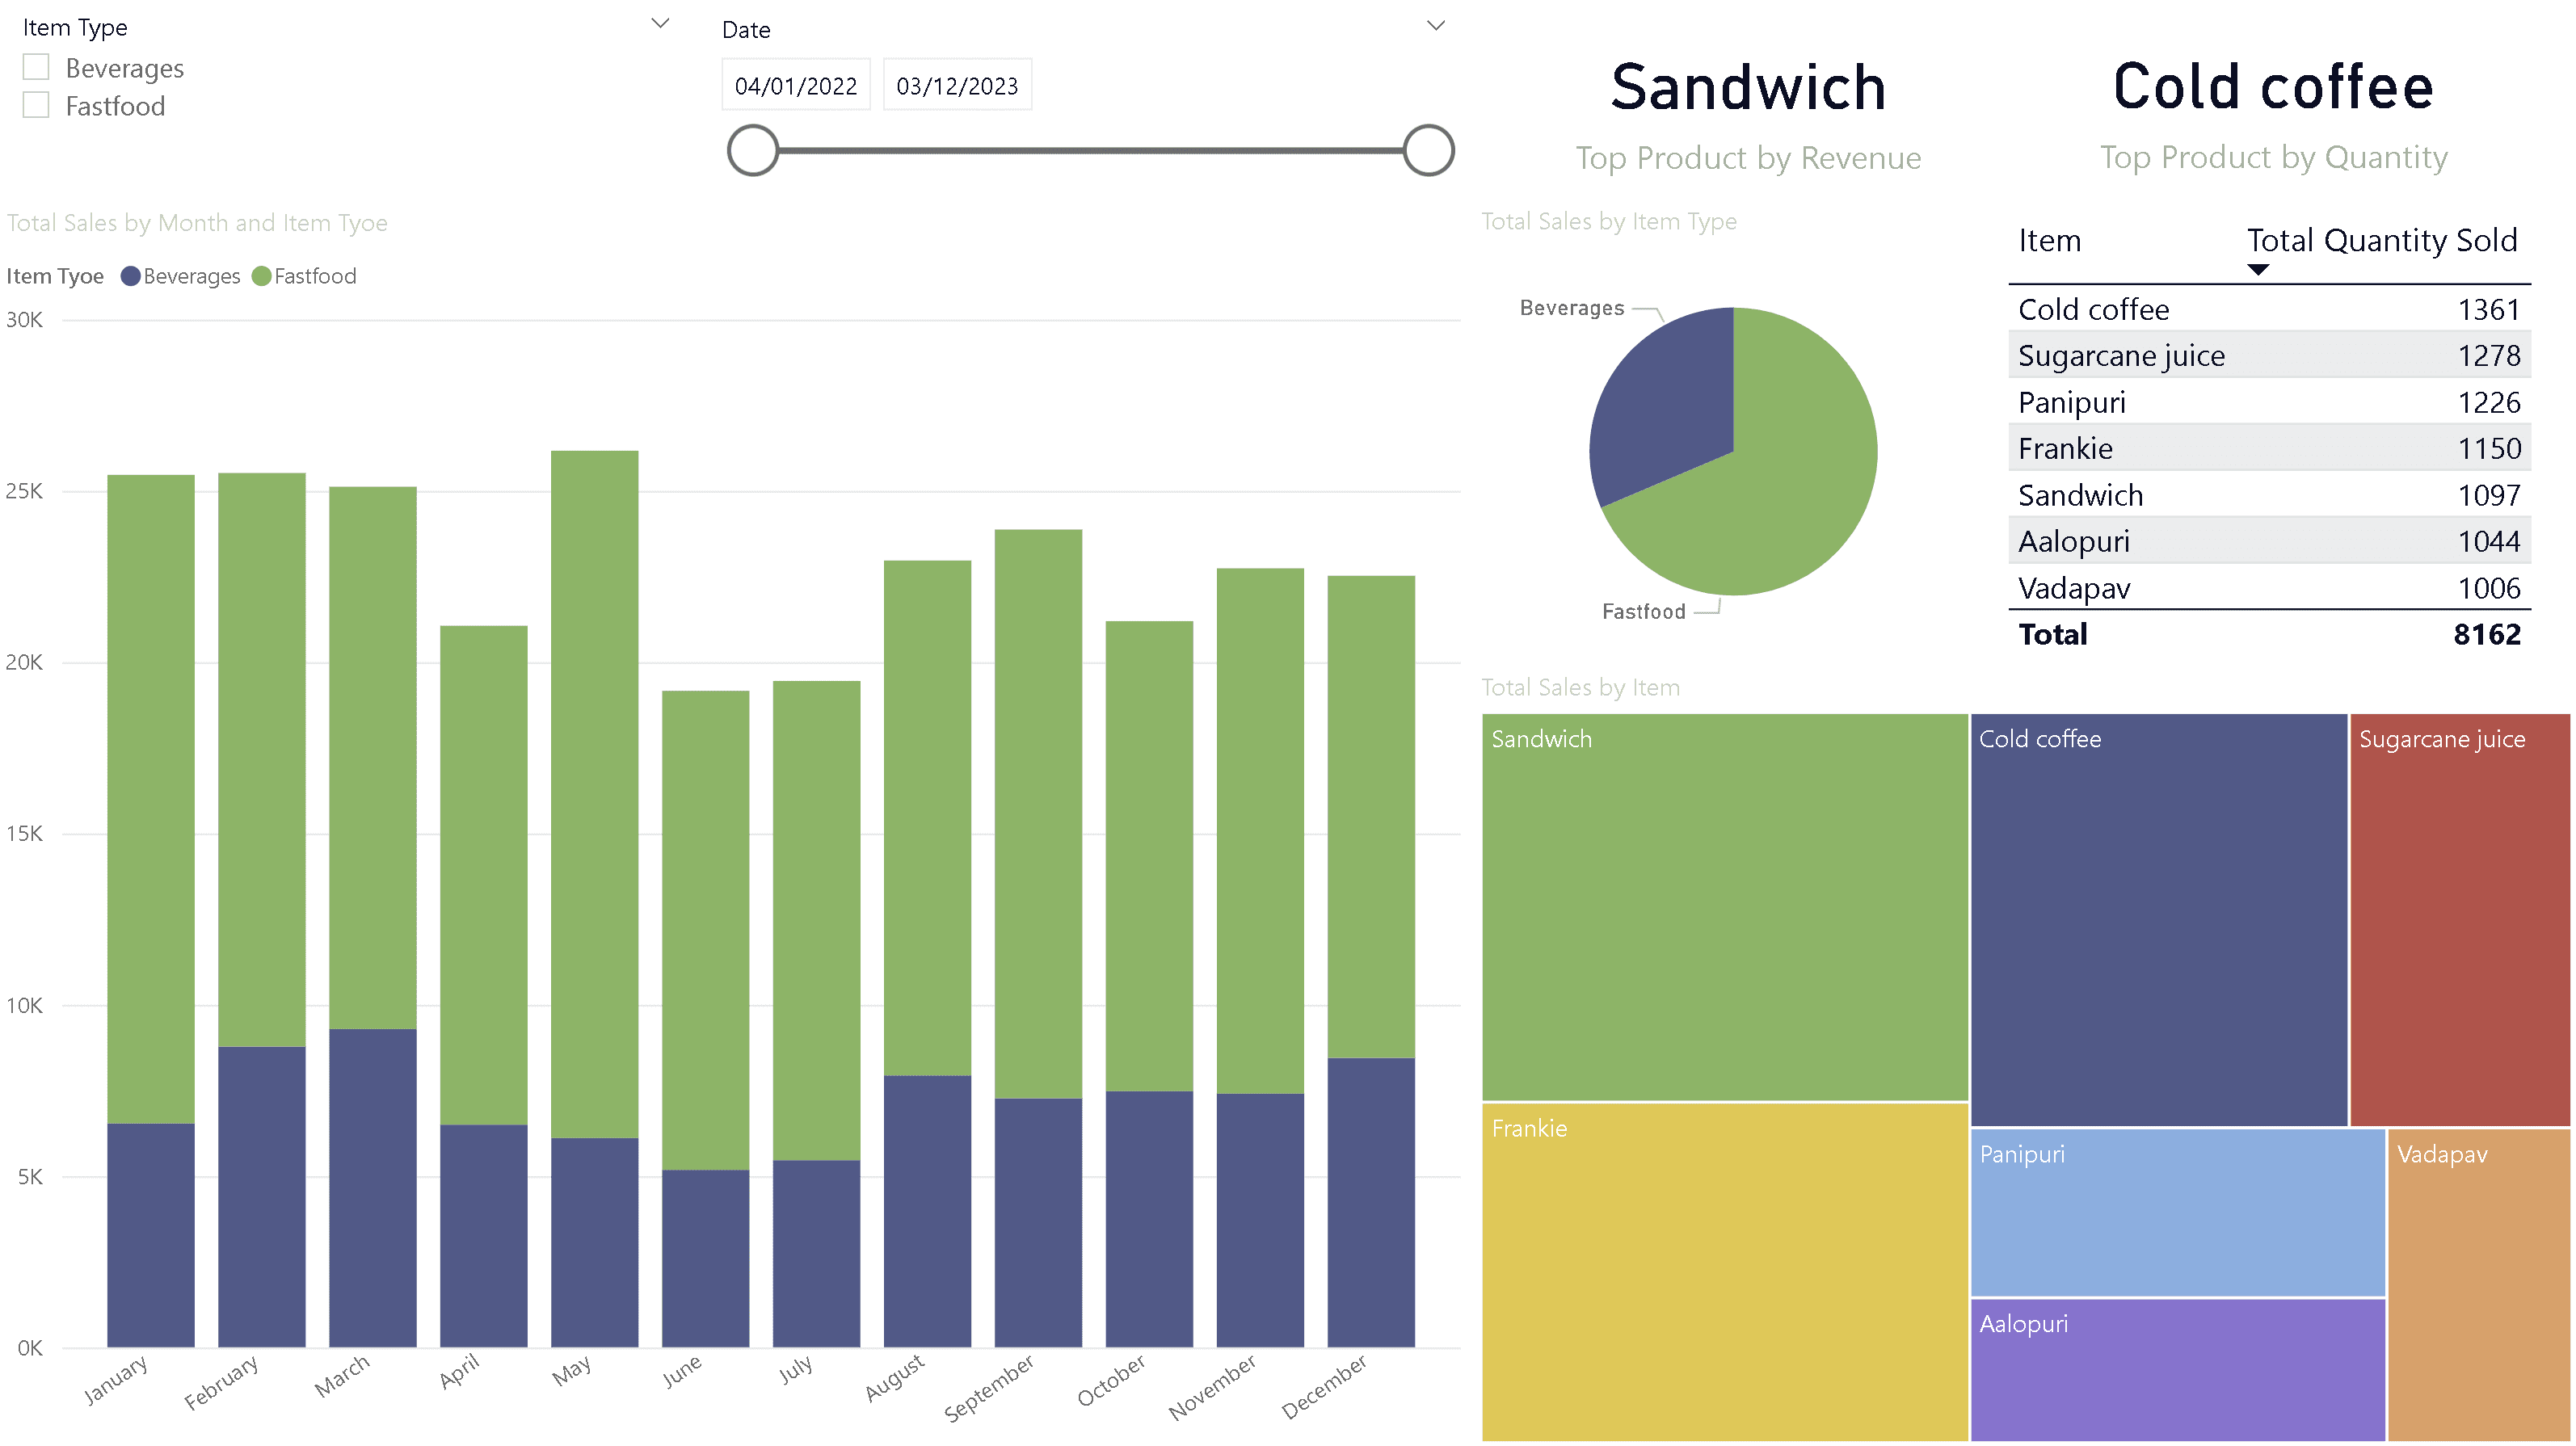
- Top product by revenue: Sandwich
- Top product by quantity sold: Cold coffee (1,361 units)
- Fast food contributes the majority of sales
- Cold coffee, Sugarcane juice, and Panipuri are high-quantity sellers
2. Sales Overview by Time

- Total sales: $275K
- Average daily sales: $790.89
- Sales peaked in May, dipped in June
- Sales consistent across quarters
3. Sales Patterns by Weekday & Time

- Monday has the highest total sales
- Friday and Tuesday are the lowest sales days
- Afternoon and Night are the most active time slots
- Heatmap shows Afternoon activity across all days
4. Transaction & Payment Type Insights

- Total transactions: 1,000,000
- Average transaction value: $275.23
- Cash: 476K transactions | $132,840 total
- Online: 417K transactions | $110,595 total
- Other: 107K transactions | $31,795 total
- Cash is the dominant payment method
- Highest transaction volume in May
My Contributions
I led the entire ETL and visualization process—writing Python scripts for data parsing, validating accuracy, performing feature engineering, and building the final dashboard in Power BI. Designed for stakeholders to identify trends and plan inventory and staffing accordingly.
Download the full report to explore insights and methodology in more detail.
Balaji Foods Sales Pipeline
An end-to-end ETL pipeline to clean transaction data and analyze weekly performance, revenue patterns, and payment trends using Power BI dashboards.
Tools & Technologies: Python, Pandas, Power BI, DAX
Extract
Raw Sales Data Collection
Imported sales data from multiple sources with inconsistent date formats (dd-mm-yyyy, mm/dd/yyyy) and missing fields.
Initial Validation
Validated basic structure and flagged corrupted or empty rows, ensuring no duplicate entries or broken headers.
*This dashboard is based on simulated data for internal analytics demonstration.